Navigating the complex world of stock market investments requires a deep understanding of various factors, and one key aspect is historical data. Investors often find themselves delving into historical data to gain insights, identify trends, and make informed decisions. In this article, we will explore the importance of navigating stock index historical data and provide valuable tips for investors.
What Is Stock Index Historical Data?
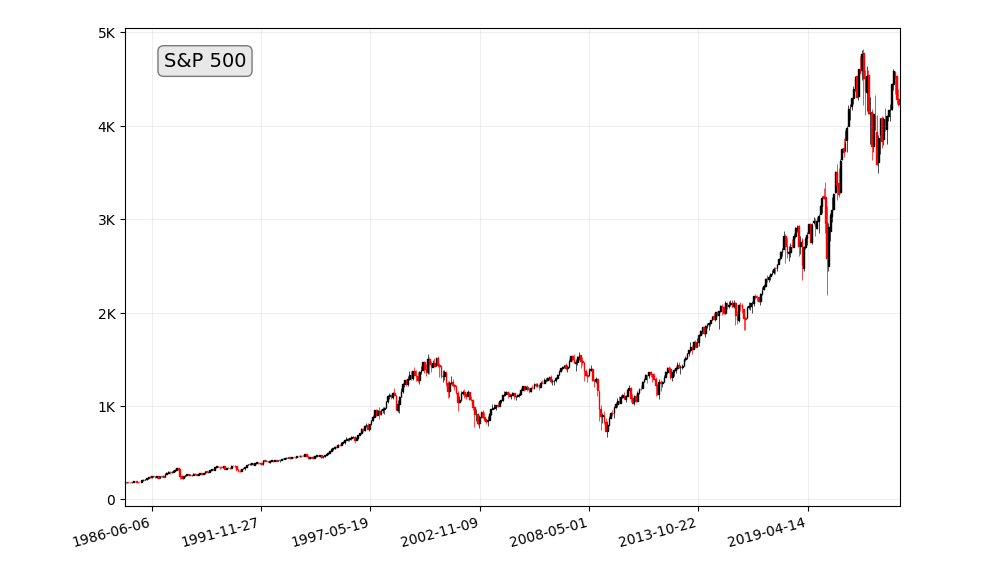
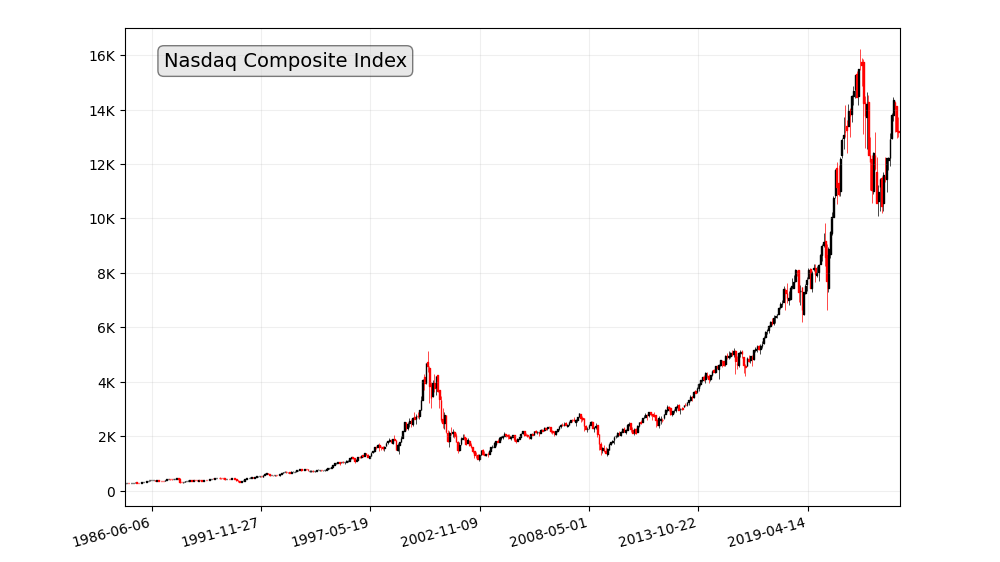
Stock index historical data refers to a comprehensive record of past market performance, capturing the price movements, volumes, and other relevant metrics of a basket of stocks that constitute a particular index. It serves as a valuable resource for investors to analyze and understand how the market has behaved over time.
Understanding historical data is like having a roadmap for investors. It offers insights into market behavior, helps in identifying trends and patterns, and ultimately empowers investors to make informed decisions. Historical data provides a context that is crucial for predicting potential future market movements.
Where to Find Stock Index Historical Data
Accessing stock index historical data has become more convenient with the proliferation of online financial platforms. These platforms offer a wealth of information, including historical data, charts, and analytical tools. Additionally, specialized historical data sources and databases cater to the needs of investors looking for in-depth analysis.
Unveiling Data Sources: A Comprehensive Guide
The quest for stock index historical data can lead you to a plethora of resources, each offering unique advantages and considerations. Let’s delve into the diverse landscape of data sources:
- Financial Data Providers: Renowned entities like Bloomberg, Reuters, and S&P Global Market Intelligence stand as treasure troves of market information. These providers compile and distribute comprehensive data packages, including daily, weekly, and monthly closing prices, volume figures, and dividend information, for a wide range of stock indices.
- Online Resources and Websites: The internet has democratized access to financial data, with numerous websites and online resources readily providing historical data for major stock indices. Platforms like Yahoo Finance, stooq.com, Trading View, Google Finance, and Investing.com offer interactive charts, customizable data filters, and analytical tools to facilitate data exploration and analysis.
- Government and Regulatory Databases: Central banks and securities regulators, such as the U.S. Securities and Exchange Commission (SEC), maintain historical data for stock indices within their respective jurisdictions. These databases provide a reliable and often free source of historical data for specific indices or market segments.
Selecting the Right Source: A Matter of Needs and Preferences
The choice of data source depends on your specific needs and preferences. Here are some factors to consider:
- Depth and Breadth of Data: Assess the range of indices and data points available. Some providers offer extensive coverage, while others focus on specific market segments or regions.
- Accessibility and Usability: Consider the ease of access and the user-friendliness of the platform. Some providers offer intuitive interfaces and powerful search functionality.
- Data Quality and Reliability: Ensure the data source employs rigorous data collection and aggregation methods to maintain data integrity and accuracy.
- Cost and Pricing Models: Evaluate the pricing structure and subscription options, ensuring they align with your budget and usage patterns.
Key Metrics in Stock Index Historical Data
Analyzing historical data involves looking at various metrics, including price movements, volume trends, and dividend yields. These metrics provide a comprehensive view of how a particular stock index has performed over time.
Embracing Advanced Techniques for Stock Index Historical Data Analysis
Leveraging Technical Analysis Indicators for Trend Identification
Investors use various techniques for analyzing trends and patterns in historical data. Technical analysis involves studying charts and using statistical tools, while fundamental analysis considers economic indicators and financial statements. The combination of these approaches helps investors make well-informed decisions.
Technical analysis involves the study of past price and volume data to identify patterns and trends that may predict future market movements. Investors can utilize technical indicators, such as moving averages, Bollinger Bands, and Relative Strength Index (RSI), to identify potential entry and exit points for trades.
Utilizing Statistical Methods for Risk Assessment and Portfolio Optimization
Statistical methods, such as Sharpe ratio and Sortino ratio, can be employed to assess the risk-adjusted returns of different investment strategies. Portfolio optimization techniques, such as Modern Portfolio Theory (MPT), utilize historical data to create portfolios with optimal risk-return profiles.
Incorporating Machine Learning and Artificial Intelligence for Predictive Modeling
Automation is becoming increasingly prevalent in data analysis. AI-driven tools can process vast amounts of historical data, identify patterns, and provide actionable insights, enhancing the decision-making process for investors.
Machine learning and artificial intelligence (AI) are increasingly being applied to stock index historical data analysis. Machine learning algorithms can identify complex patterns and relationships within historical data that may not be readily apparent using traditional analysis methods. AI-powered predictive models can help investors make more informed investment decisions based on historical trends and market insights.
Understanding Market Sentiment Through Historical Data
Beyond traditional metrics, understanding market sentiment through historical data is gaining importance. Social media and sentiment analysis tools contribute to gauging the mood of the market, providing an additional layer of insight for investors.
While historical data is a valuable resource, it comes with its set of challenges. Ensuring the accuracy and reliability of the data is paramount. Investors also need to make adjustments for factors like dividends and stock splits to ensure a more accurate analysis.
Recognizing the Impact of Historical Events on Data
Historical data is not a foolproof predictor of future market performance. Significant historical events, such as economic crises, political upheavals, and technological breakthroughs, can have a profound and unpredictable impact on market trends.
Understanding the Role of Data Aggregation and Sampling
Historical data may be subject to aggregation and sampling techniques, which can affect the precision and accuracy of the data. Investors should be aware of these limitations and seek data from reputable sources that employ rigorous data collection and aggregation methods.
Mitigating the Risks of Data Bias and Errors
Historical data may be affected by biases and errors, such as data manipulation, outliers, and missing observations. Investors should critically evaluate the sources and quality of historical data, employ data cleaning techniques, and consider multiple data sources to mitigate the impact of potential biases and errors.
Embracing Stock Index Historical Data for Informed Investment Decisions
Integrating Historical Data into Investment Research and Analysis
Stock index historical data is an indispensable tool for investment research and analysis. Investors should integrate historical data into their investment decision-making process, using it to identify trends, evaluate risks, and make informed choices about asset allocation, portfolio management, and investment strategies.
Utilizing Data-Driven Strategies to Enhance Portfolio Management
By effectively utilizing historical data, investors can develop data-driven strategies to enhance portfolio management. Backtesting, a technique that involves applying investment strategies to historical data to evaluate their potential performance, can help investors refine their strategies and identify areas for improvement.
Making Informed Decisions Based on Historical Trends and Market Insights
Historical data provides valuable context for understanding market trends, investor behavior, and the impact of various factors on market performance. By analyzing historical data, investors can gain a deeper understanding of market dynamics and make informed decisions based on sound historical and analytical insights.
Tools and Software for Analyzing Stock Index Historical Data
A plethora of tools and software are available for investors to analyze stock index historical data. These tools offer features such as customizable charts, technical indicators, and trend analysis, making the process more efficient and insightful.
Examining real-world examples of successful navigation of historical data provides valuable lessons for investors. These case studies illustrate how investors applied historical data to make strategic investment decisions and achieve positive outcomes.
Tips for Novice Investors
For novice investors, navigating historical data may seem overwhelming. Simplifying data interpretation, focusing on key metrics, and avoiding common mistakes are essential tips for those starting their investment journey.
Future Trends in Analyzing Stock Index Historical Data
The field of financial data is constantly evolving, with new data sources, methodologies, and analytical tools emerging regularly. Investors should embrace continuous learning and adapt to these advancements to stay at the forefront of data-driven investment strategies. By staying informed about new developments and incorporating them into their investment decision-making process, investors can navigate the complexities of financial markets with greater confidence and achieve their financial goals.
Emerging technologies, such as artificial intelligence and machine learning, are playing a significant role in shaping the future of analyzing stock index historical data.
Conclusion
In conclusion, navigating stock index historical data is a crucial aspect of successful investing. It provides a roadmap of the market’s past, offering valuable insights for making informed decisions. Continuous learning and adaptation to new technologies are essential for investors to stay ahead in the dynamic world of finance.
FAQs
- What is the best timeframe to analyze historical data?
- The best timeframe depends on the investor’s goals. Short-term traders may focus on daily or hourly data, while long-term investors may analyze monthly or yearly trends.
- How often should investors review historical data?
- Regular reviews, at least quarterly, are advisable. However, major market events may warrant more frequent reviews.
- Are there free sources for stock index historical data?
- Yes, some financial platforms offer free access to basic historical data. However, more comprehensive data may require subscription or purchase.
- Can historical data predict future market movements?
- While historical data provides valuable insights, it cannot predict future movements with certainty. It helps in making informed decisions based on historical patterns.
- How do stock analysts use historical data in their research?
- Stock analysts use historical data to identify trends, assess risk, and make predictions about future market movements. It forms a crucial part of their research toolkit.