In the dynamic world of finance, making informed investment decisions is crucial for every investor. One valuable tool in an investor’s toolkit is the historical performance data of major market indices. These indices provide valuable insights into the past behavior of financial markets, helping investors predict future trends and mitigate risks. In this article, we will delve into the historical performance of major market indices and explore how investors can use this data to make informed decisions.
Historical Performance of Major Market Indices: A Guide for Informed Investment Decisions
What are Market Indices?
Before we dive into historical data, it’s essential to understand what market indices are. Market indices are a collection of stocks or other assets that represent a particular segment of the financial market. They are used to gauge the overall performance of that segment.
They are calculated by averaging the stock prices of a selected group of companies weighted most often by market cap, but sometimes by stock price. Market indices can be used to track the performance of a particular sector of the economy, such as the technology sector or the healthcare sector, or they can be used to track the performance of the overall stock market.
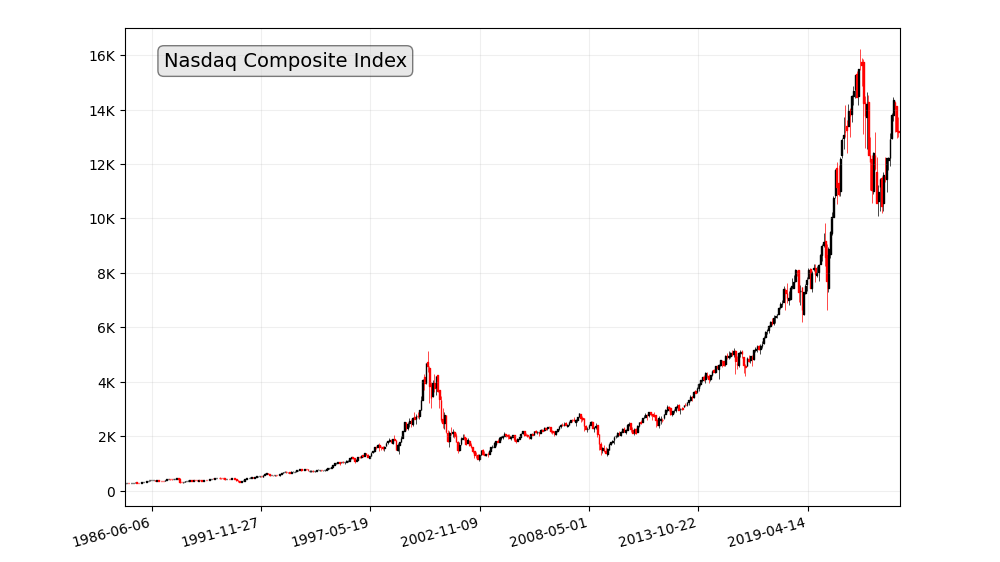
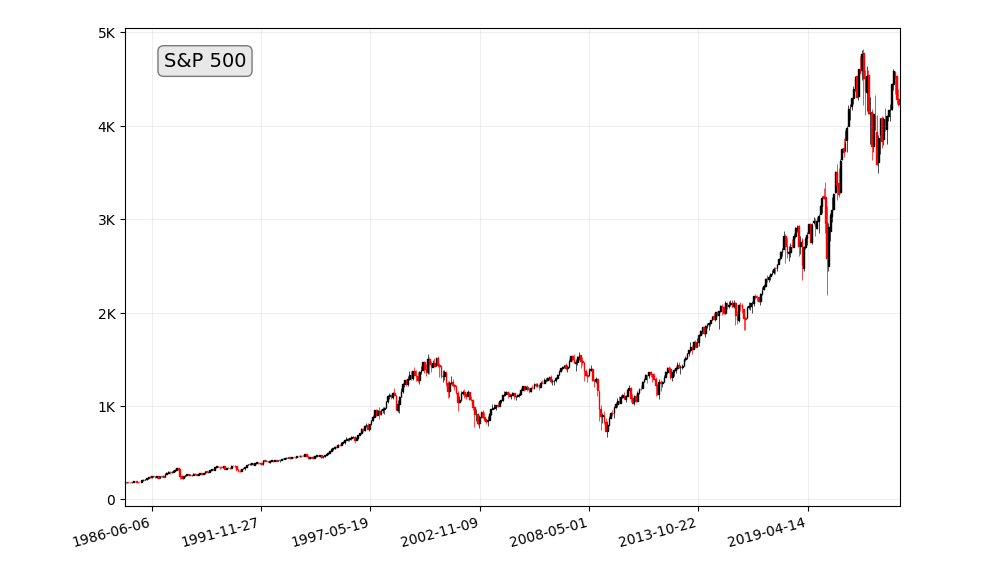
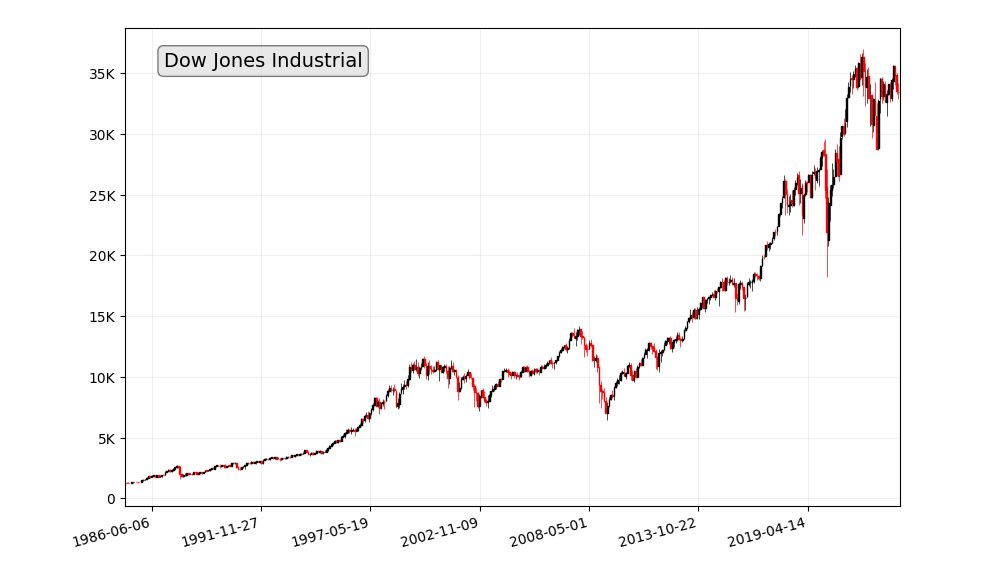
Commonly known market indices include the S&P 500, Dow Jones Industrial Average, and the NASDAQ Composite.
- Nasdaq Composite Index: The Nasdaq Composite Index is a stock market index that tracks the performance of all stocks listed on the Nasdaq stock exchange.
- S&P 500: The S&P 500 is a stock market index that tracks the performance of the 500 largest publicly traded companies in the United States.
- Dow Jones Industrial Average: The Dow Jones Industrial Average is a stock market index that tracks the performance of 30 large publicly traded companies in the United States.
Historical Performance of Stock Market Indices
Historical data reveals the performance of these indices over the years. For instance, the S&P 500, which tracks 500 of the largest publicly traded companies in the U.S., has shown remarkable growth over its history, despite occasional setbacks like the 2008 financial crisis.
The stock market has historically performed well over the long term. For example, the S&P 500 has returned an average of 10% per year since 1926. This means that if you had invested $10,000 in the S&P 500 in 1926, your investment would be worth over $100 million today.
Of course, the stock market does not go up in a straight line. There will be periods of time when the market goes down, and there will be periods of time when the market goes up. However, over the long term, the stock market has trended upwards.
How Investors Use Historical Data
Investors use historical data to make informed investment decisions. By analyzing past performance, they can identify patterns and trends, helping them allocate their investments wisely. It also aids in setting realistic expectations and assessing potential risks.
Analyzing Trends in Market Indices
Analyzing historical data involves looking for trends and patterns. Investors often use techniques like technical analysis and charting to spot trends that can guide their decisions.
Factors Affecting Market Index Performance
Various factors influence the performance of market indices. Economic indicators, geopolitical events, and company-specific news can have a significant impact. Understanding these factors is key to interpreting historical data accurately.
Historical Market Crashes and Recoveries
History is rife with market crashes and subsequent recoveries. Studying these events can provide valuable insights into the resilience of financial markets and how investors have responded.
The stock market is a risky investment. There is always the possibility that you could lose some or all of your investment. However, the stock market has also historically been a very rewarding investment. Over the long term, the stock market has trended upwards and investors have made a lot of money.
The Role of Market Indices in Portfolio Diversification
Market indices play a critical role in diversifying investment portfolios. By investing in index-tracking funds or ETFs, investors can spread their risk across a wide range of assets.
Historical Performance Metrics
Metrics such as return on investment (ROI), volatility, and Sharpe ratio are used to evaluate the historical performance of indices. These metrics help investors compare different indices.
Return on Investment (ROI)
Return on Investment, commonly referred to as ROI, is a fundamental measure of an investment’s profitability. It quantifies the return an investor earns on a specific investment relative to the initial capital invested. The ROI formula is simple:
ROI = (Net Profit / Cost of Investment) x 100
For example, if you invested $10,000 in a stock and sold it for $12,000, your ROI would be 20%:
ROI = (($12,000 – $10,000) / $10,000) x 100 = 20%
ROI is a key indicator of how well an investment has performed, and it’s often used to compare the relative performance of different assets in your portfolio. Investors should consider the timeframe for which ROI is calculated, as it can vary widely depending on short-term or long-term investments.
Volatility
Volatility measures the degree of variation of an asset’s price over time. It is often associated with risk, as more volatile assets can experience larger and more frequent price fluctuations. Volatility can be quantified using standard deviation or other statistical measures.
Understanding the historical volatility of a stock is crucial for investors. Highly volatile assets may offer significant opportunities for profit, but they also come with a higher level of risk. Less volatile assets may provide stability but potentially at the cost of slower returns.
Investors must assess their risk tolerance and investment horizon to determine which level of volatility is suitable for their portfolio. Historical volatility data can be used to make more informed investment decisions.
Sharpe Ratio
The Sharpe ratio, named after Nobel laureate William F. Sharpe, takes into account both an investment’s return and its risk (as measured by volatility) to evaluate its performance. The formula for the Sharpe ratio is as follows:
Sharpe Ratio = (Return of Investment – Risk-Free Rate) / Volatility of Investment
The Sharpe ratio allows investors to assess whether the return of an investment is adequate given the level of risk. It provides a single number that quantifies the risk-adjusted return, making it easier to compare different investments.
A higher Sharpe ratio indicates better risk-adjusted performance. Investors typically use the Sharpe ratio to make more informed decisions about portfolio allocation. It helps them determine whether the potential return justifies the level of risk they are taking on.
Tools for Analyzing Historical Data
Investors have access to numerous tools and resources to analyze historical data. These tools can provide valuable insights and make the analysis more efficient.
There are a number of different tools available to help investors analyze stock market data, including:
- Financial websites: Many financial websites, such as Yahoo Finance and Google Finance, offer free stock charts and analysis tools. These tools can be used to track stock prices, identify trends, and compare different stocks.
- Charting software: Charting software allows investors to create and customize their own charts. This software can be used to identify technical indicators and patterns that can be used to predict future performance.
- Stock screeners: Stock screeners allow investors to filter stocks based on a variety of criteria, such as market capitalization, industry, and price-to-earnings ratio. This can help investors to identify potential investment opportunities.
- Backtesting software: Backtesting software allows investors to test their trading strategies on historical data. This can help investors to identify which strategies are most likely to be successful in the future.
Here are some of the most popular tools for analyzing stock market historical data:
- Yahoo Finance: Yahoo Finance is a popular financial website that offers a variety of free stock charts and analysis tools. Yahoo Finance charts can be customized to show a variety of different technical indicators, such as moving averages and Bollinger Bands. Yahoo Finance also offers a number of other tools, such as stock screeners and news feeds.
- Google Finance: Google Finance is another popular financial website that offers a variety of free stock charts and analysis tools. Google Finance charts can be customized to show a variety of different technical indicators, such as moving averages and MACD. Google Finance also offers a number of other tools, such as stock screeners and news feeds.
- TradingView: TradingView is a popular charting software platform that offers a wide range of features, including a variety of technical indicators, drawing tools, and customizable charts. TradingView also offers a number of other tools, such as stock screeners and news feeds.
- Thinkorswim: Thinkorswim is a popular charting software platform offered by TD Ameritrade. Thinkorswim offers a wide range of features, including a variety of technical indicators, drawing tools, and customizable charts. Thinkorswim also offers a number of other tools, such as backtesting software and news feeds.
- AmiBroker: AmiBroker is a popular backtesting software platform that offers a wide range of features, including a variety of technical indicators, charting tools, and backtesting capabilities. AmiBroker is a paid software platform, but it offers a free trial.
When choosing tools for analyzing stock market historical data, it is important to consider your needs and budget. If you are a beginner, you may want to start with a free tool such as Yahoo Finance or Google Finance. As you become more experienced, you may want to consider using a paid tool such as TradingView or Thinkorswim.
It is also important to note that no tool is perfect. All tools have their own strengths and weaknesses. It is important to use a variety of tools and to cross-reference your results.
Risks and Challenges
It’s essential to acknowledge that historical data is not foolproof. There are risks associated with relying solely on past performance data, and investors should be aware of these potential pitfalls.
Long-Term vs. Short-Term Strategies
Historical data can guide both long-term and short-term investment strategies. While long-term investors may focus on overall market trends, short-term traders may look for daily or weekly patterns.
Case Studies
Examining case studies of successful investors who used historical performance data can offer valuable lessons and inspire others to make data-informed decisions.
Conclusion
In conclusion, historical performance data of major market indices is a treasure trove of information for investors. It provides insights into market behavior, helps with risk assessment, and supports the decision-making process. By using this data wisely, investors can navigate the complex world of finance with greater confidence.
Frequently Asked Questions
1. What are the most commonly tracked market indices?
- Commonly tracked market indices include the S&P 500, Dow Jones, NASDAQ Composite, and many others, each representing different segments of the financial market.
2. How can investors access historical performance data?
- Investors can access historical performance data through financial news outlets, online platforms, and financial research websites.
3. What metrics are essential for evaluating historical index performance?
- Metrics like ROI, volatility, and Sharpe ratio are commonly used to assess historical index performance.
4. Are there any risks associated with relying on historical data for investment decisions?
- Yes, there are risks, such as assuming that past performance guarantees future results or neglecting external factors that may affect market behavior.
5. Can historical data be used for both short-term and long-term investment strategies?
- Yes, historical data can inform both short-term and long-term investment strategies, depending on an investor’s goals and preferences.